GUIDE TO CREATING A SIMPLE HOME WEATHER STATION ON YOUR OWN
If your computer is turned on all day or even around the clock, you can use it to operate your home weather station. The goal is to create a simple and inexpensive weather station that will use a personal computer (PC). The PC acts as a reader, processor and sender of measured meteorological data to the Meteopost website. Communication between the computer and the measuring unit will be carried out via a 1-Wire network.
Composition of the measuring complex
1. Personal computer with the operating system Windows XP or higher and a free COM port.
2. Adapter for COM port (1wire - RS232 converter)
3. 4-core twisted pair Ethernet cable, the length should be sufficient from the COM port to the measuring unit
4. 5V DC power supply with good voltage regulation
5. Measuring unit (installed outdoors)
6. PC software - "Weather station" application.
OPTION No. 1 - ONE SENSOR
First, let's consider the simplest option - a weather station with one temperature sensor. This does not require an additional power supply (item 4). And the system is very simplified. The adapter for the COM port (item 2) can be made according to this scheme. The adapter consists of two zener diodes at 3.9V and 6.2V, two Schottky diodes and one resistor.
Adapter diagram for COM port

Adapter in D-SUB housing
The place where the cable and temperature sensor are soldered, including the sensor terminals, must be well protected from moisture. It is best to use polyurethane-based glue.

Waterproofing sensor leads
This system will provide temperature monitoring with an accuracy of tenths of a degree. In this case, a graph of air temperature versus time will be visible in the application window and the tray icon will always show the current temperature. The application allows you to set the measurement interval.
COST OF RADIO PARTS - no more than 50 UAH.
OPTION No. 2 - FOUR SENSORS
A more complex weather station with four sensors: temperature, humidity, light, pressure. Since only the temperature sensor will be digital, and the rest will be analog, the system uses a four-channel ds2450 ADC. This ADC supports 1-wire protocol. The circuit requires an additional power source. The power source must provide high voltage stability. But since the circuit of the adapter described above has a drawback - the inability to connect an external power source to the sensors due to the lack of real ground (-), we use a different adapter circuit. This adapter also fits into the housing of the D-SUB COM port connector. Now there are three wires in the cable: ground (-), +5V and data.
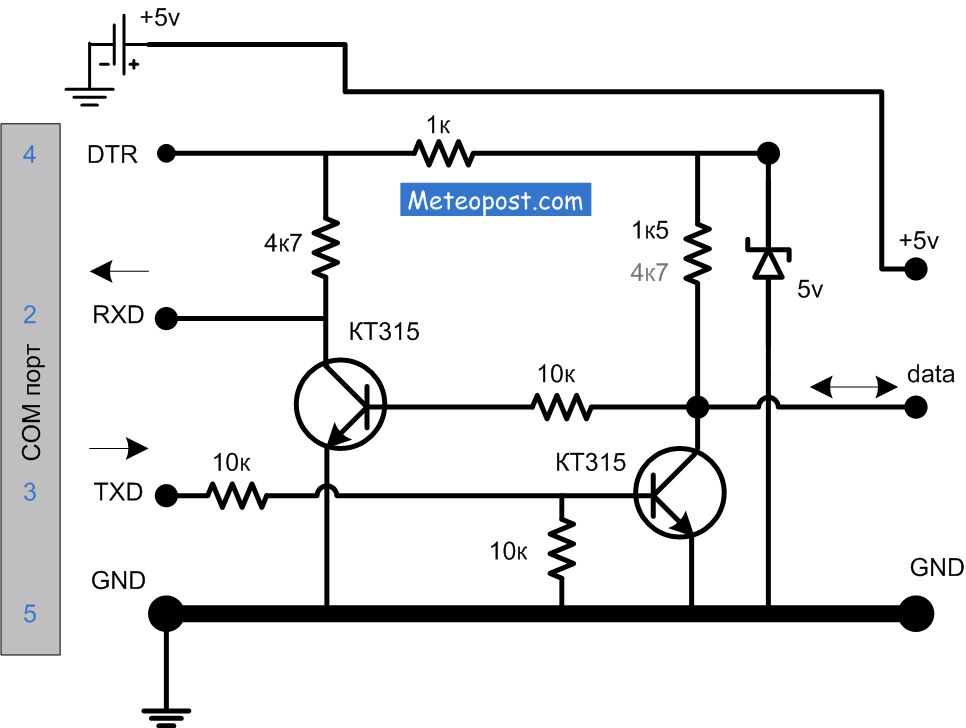
Adapter circuit for COM port with external power supply
The circuit of the measuring unit can easily be made even on a breadboard. You just need to pay special attention to waterproofing the contacts. The easiest way is to melt paraffin and apply it with a brush to all bare spots on the board. If the board is not protected from water, there will be voltage leaks and there will be many measurement errors. In our case, even hundredths of a Volt significantly affect the results.

Measuring block diagram
The measuring unit must be placed in a housing such that the board and sensors are protected from direct exposure to precipitation and solar radiation. A box made of dense foam plastic is well suited for these purposes. In the walls of the box (bottom and wall on the shadow side) you need to make more holes for ventilation. It is advisable to cover the inside walls of the box with aluminum foil for additional protection from infrared radiation, otherwise there will be an error in temperature measurement. All sensors, except for light, are placed directly on the board. The light sensor (photoresistor) is removed from the board on wires and installed in the hole in the bottom of the foam housing. So that the sensor surface faces down. In this case, precipitation will not fall on the sensor and, especially in winter, this will protect it from icing. For waterproofing, the light sensor must be treated, for example, with transparent polyurethane-based glue (silicone sealant did not pass the test, it leaked current). Treat inclusively (!) the photosensitive zone of the photoresistor. Fill the sensor leads with glue and place them in an insulating tube. Solder the ends of the leads to a small board. And solder the wires from the measuring unit to this board. Fill the soldering areas with paraffin. Otherwise, when there is heavy rain and wind, the weather station may become inoperable and you will have to disassemble it and dry everything out. The unit can be connected to the cable using a connector. But you need to use a special moisture-proof connector - the system will work in difficult weather conditions.
If you have to place the case outside the window of a high-rise building (it is not possible to install it on a stand near the ground), then the box must be removed from the wall of the house as far as possible, on a bracket. Otherwise, heating the air from the wall gives very distorted temperature data. In a private home, it is better, of course, to make a real weather booth. We need to take care that the housing is securely fastened, otherwise strong gusts of wind can tear off our structure.

Measuring unit on bracket
The output voltage of the power supply (PSU) should be within 4.8-5.3V. Charging from an old phone will also work. However, if the power supply does not have a stabilizer, you need to add it to the power supply, because For measurement accuracy, the presence of a stable voltage is very important. You can at least check with a tester whether tenths or hundredths of a volt change at the output of the power supply. Jumps of tenths of a volt are not allowed. A simple 5V stabilizer circuit is shown below. The power supply input can be from 7 to 17V. The output will be about 5V. After this, you need to connect our cable (which goes to the measuring unit) to the power supply and measure the voltage with a tester at the other end of the cable. This voltage may be slightly lower than directly at the power supply output due to cable resistance. This measured voltage must be entered in the application settings as "Sensor supply voltage".

Typical voltage regulator circuit
COST OF COMPONENTS FOR THE WEATHER STATION
Approximate cost of radio components (2015 prices in the store).
1. Temperature sensor ds18b20 - 25 UAH
2. ADC ds2450 - 120 UAH
3. Photoresistor LDR07 - 6 UAH
4. Humidity sensor HIH-5030 - 180 UAH
5. Pressure sensor MPX4115A - 520 UAH.
TOTAL: 850 UAH or 37$
The remaining elements in total cost no more than 50 UAH; the power supply can be taken, for example, from an old “charger” for your phone.

Marking of radio elements
SOFTWARE FOR WEATHER STATION
We have developed an application for Windows that we will provide free of charge to anyone who wants to build such a weather station. It will allow you to monitor the weather on your PC.

PC application window

The system tray displays the air temperature
The application can send all measured data to our “Meteopost” server and on a special page (example) you can view all weather data from a PC browser. The page is also adapted for a mobile phone browser.

Mobile phone browser screenshot
CONCLUSION
You can save on the cost of parts if you buy them from the Chinese on AliExpress. It is possible to assemble a weather station without any of the sensors, with the exception of the temperature sensor. Our ADC has one free input left, so it can also receive a signal from the wind sensor. But since we are in the city, we simply have nowhere to install and test such a sensor. In urban areas there will not be adequate measurement of wind speed and direction. Methods for making a wind speed sensor yourself are described in detail by many enthusiasts on the network. The factory sensor is quite expensive.
A radio amateur with average skills can assemble such a weather station. To make it even simpler, you can not lay out the printed circuit board, but assemble it by surface mounting on a breadboard. Tested - it works.
We tried to create an accessible, cheap weather station. In particular, a computer is used in the system for this purpose. If you exclude it, then you need to make an additional display unit, a data transmission unit to the network, etc., which will significantly increase the price. For example, the now popular “Netatmo Weather Station” with similar measured parameters costs about 4,000 UAH ($200).
We are ready to help anyone who wants to make such a weather station with consultations. We will also provide the necessary software and connect your station to our website.
Recently, a colleague of mine organized a small science exhibition.
My teacher asked me to present an electronics project to students in college. I had two days to come up with something interesting and quite simple.


Since the weather conditions here are quite changeable, and the temperature fluctuates in the range of 30-40°C, I decided to make a home weather station.
What are the functions of a home weather station?
An Arduino weather station with display is a device that collects data about weather and environmental conditions using a variety of sensors.
Typically these are the following sensors:
- wind
- humidity
- rain
- temperature
- pressure
- heights
My goal is to make a portable desktop weather station with my own hands.
It should be able to determine the following parameters:
- temperature
- humidity
- pressure
- height
Step 1: Buy the necessary components


- DHT22, temperature and humidity sensor.
- BMP180, pressure sensor.
- Solder
- Single row 40 output connector
Equipment you will need:
- Soldering iron
- Nose pad pliers
- Wires
Step 2: DHT22 Temperature and Humidity Sensor


Various sensors are used to measure temperature. DHT22, DHT11, SHT1x are popular
I'll explain how they differ from each other and why I used DHT22.
The AM2302 sensor uses a digital signal. This sensor operates on a unique coding system and sensor technology, so its data is reliable. Its sensor element is connected to an 8-bit single-chip computer.
Each sensor of this model is temperature compensated and precisely calibrated; the calibration coefficient is located in a one-time programmable memory (OTP memory). When reading the readings, the sensor will recall the coefficient from memory.
Small size, low power consumption, long transmission distance (100m) make the AM2302 suitable for almost all applications, and 4 outputs in one row make installation very simple.
Let's look at the pros and cons of the three sensor models.
DHT11
Pros: does not require soldering, the cheapest of the three models, fast stable signal, range over 20 m, strong interference.
Cons: Library! There are no resolution options, temperature measurement error is +/- 2°C, relative humidity level measurement error is +/- 5%, inadequate range of measured temperatures (0-50°C).
Areas of application: gardening, agriculture.
DHT22
Pros: does not require soldering, low cost, smoothed curves, small measurement errors, large measurement range, range greater than 20 m, strong interference.
Cons: sensitivity could be higher, slow tracking of temperature changes, requires a library.
Areas of application: environmental studies.
SHT1x
Pros: no soldering required, smooth curves, low measurement errors, fast response, low power consumption, automatic sleep mode, high stability and data consistency.
Cons: two digital interfaces, error in measuring humidity levels, measured temperature range 0-50°C, library required.
Areas of application: operation in harsh environments and in long-term installations. All three sensors are relatively inexpensive.
Compound
- Vcc – 5V or 3.3V
- Gnd - with Gnd
- Data – to the second Arduino pin
Step 3: BMP180 Pressure Sensor


BMP180 – barometric atmospheric pressure sensor with I2C interface.
Barometric pressure sensors measure the absolute value of the ambient air. This indicator depends on specific weather conditions and altitude above sea level.
The BMP180 module had a 3.3V 662kOhm stabilizer, which I, out of my own stupidity, accidentally blew up. I had to route the power supply directly to the chip.
Due to the lack of a stabilizer, I am limited in the choice of power source - a voltage above 3.3V will destroy the sensor.
Other models may not have a stabilizer, be sure to check for its presence.
Connection diagram of the sensor and I2C bus with Arduino (nano or uno)
- SDA-A4
- SCL - A5
- VCC - 3.3V
- GND - GND
Let's talk a little about pressure and its relationship with temperature and altitude.
Atmospheric pressure at any point is not constant. The complex interaction between the Earth's rotation and the tilt of the Earth's axis leads to the appearance of many areas of high and low pressure, which in turn leads to daily changes in weather conditions. By observing changes in pressure, you can make short-term weather forecasts.
For example, a drop in pressure usually means rainy weather or the approach of a thunderstorm (approaching low pressure area, cyclone). Rising pressure usually means dry, clear weather (an area of high pressure, an anticyclone, is passing over you).
Atmospheric pressure also changes with altitude. The absolute pressure at Everest Base Camp (5400 m above sea level) is lower than the absolute pressure at Delhi (216 m above sea level).
Since absolute pressure readings vary in each location, we will refer to relative pressure, or sea level pressure.
Height measurement
The average pressure at sea level is 1013.25 GPa (or millibars). If you rise above the atmosphere, this value drops to zero. The curve of this fall is quite clear, so you can calculate the height above sea level yourself using the following equation: alti=44330*
If you take the sea level pressure of 1013.25 GPa as p0, the solution to the equation is your current altitude above sea level.
Precautionary measures
Remember that the BMP180 sensor needs access to the surrounding atmosphere to be able to read air pressure, do not place the sensor in a closed housing. A small ventilation hole will be enough. But don’t leave it too open - the wind will confuse the pressure and altitude readings. Consider wind protection.
Protect from heat. Measuring pressure requires accurate temperature readings. Try to protect the sensor from temperature changes and do not leave it near sources of high temperatures.
Protect from moisture. The BMP180 sensor is sensitive to humidity levels, try to prevent possible water from entering the sensor.
Don't blind the sensor. What was unexpected was the sensitivity of the silicone in the sensor to light, which could reach it through a hole in the chip cover. For the most accurate measurements, try to protect the sensor from ambient light.
Step 4: Assembling the device


Installing single-row connectors for Arduino Nano. Basically, we cut them to size and sanded them down a bit so they look just like they were. Then we solder them. Afterwards, we install single-row connectors for the DHT22 sensor.
We install a 10kOhm resistor from the data output to ground (Gnd). We solder everything.
Then we install the single-row connector for the BMP180 sensor in exactly the same way, making the power supply 3.3V. We connect everything to the I2C bus.
Lastly, we connect the LCD display to the same I2C bus as the BMP180 sensor.
(I plan to later connect an RTC module (real time clock) to the fourth connector so that the device will also show the time).
Step 5: Coding


Download libraries
To install libraries on Arduino, follow the link
#include
#include #include #include "DHT.h" #include
SFE_BMP180 pressure;
#define ALTITUDE 20.56 #define I2C_ADDR 0x27 //<<- Add your address here. #define Rs_pin 0 #define Rw_pin 1 #define En_pin 2 #define BACKLIGHT_PIN 3 #define D4_pin 4 #define D5_pin 5 #define D6_pin 6 #define D7_pin 7
#define DHTPIN 2 // what digital pin we"re connected to
// Uncomment whatever type you"re using! //#define DHTTYPE DHT11 // DHT 11 #define DHTTYPE DHT22 // DHT 22 (AM2302), AM2321 DHT dht(DHTPIN, DHTTYPE); LiquidCrystal_I2C lcd(I2C_ADDR,En_pin,Rw_pin, Rs_pin,D4_pin,D5_pin,D6_pin,D7_pin); float t1,t2;
void setup() ( Serial.begin(9600); lcd.begin(16,2); //<<-- our LCD is a 20x4, change for your LCD if needed // LCD Backlight ON lcd.setBacklightPin(BACKLIGHT_PIN,POSITIVE); lcd.setBacklight(HIGH); lcd.home (); // go home on LCD lcd.print("Weather Station"); delay(5000); dht.begin(); pressure.begin(); } void loop() { char status; double T,P,p0,a; status = pressure.startTemperature(); if (status != 0) { delay(status);
status = pressure.getTemperature(T); if (status != 0) ( Serial.print("1"); lcd.clear(); lcd.setCursor(0,0); lcd.print("Baro Temperature: "); lcd.setCursor(0,1 ); lcd.print(T,2); lcd.print(" deg C "); t1=T; delay(3000);
status = pressure.startPressure(3); if (status != 0) ( // Wait for the measurement to complete: delay(status);
status = pressure.getPressure(P,T); if (status != 0) (lcd.clear(); lcd.setCursor(0,0); lcd.print("abslt pressure: "); lcd.setCursor(0,1); lcd.print(P,2 ); lcd.print(" mb "); delay(3000);
p0 = pressure.sealevel(P,ALTITUDE); // we"re at 1655 meters (Boulder, CO)
a = pressure.altitude(P,p0); lcd.clear(); lcd.setCursor(0,0); lcd.print("Altitude: "); lcd.setCursor(0,1); lcd.print(a,0); lcd.print("meters"); delay(3000); ) ) ) ) float h = dht.readHumidity(); // Read temperature as Celsius (the default) float t = dht.readTemperature(); t2=t; lcd.clear(); lcd.setCursor(0,0); // go to start of 2nd line lcd.print("Humidity: "); lcd.setCursor(0,1);lcd.print(h); lcd.print(" %"); delay(3000); lcd.clear(); lcd.setCursor(0,0); // go to start of 2nd line lcd.print("DHT Tempurature: "); lcd.setCursor(0,1); lcd.print(t); lcd.print(" deg C "); delay(3000); lcd.clear(); lcd.setCursor(0,0); // go to start of 2nd line lcd.print("Mean Tempurature: "); lcd.setCursor(0,1); lcd.print((t1+t2)/2); lcd.print(" deg C "); delay(3000); )
I used Arduino version 1.6.5, the code fits it exactly, and it may also fit later ones. If the code is not suitable for some reason, use version 1.6.5 as a base.
MBOU secondary school of Selikhinsky rural settlement
Project topic
"Weather station at home"
Completed:
Puvis Rainis, 5th grade student.
Supervisor:
Immortal O.A.
2016
Subject : “Weather station at home.”
Hypothesis: Is it possible to create a weather station at home?
Target: Making a weather station at home and monitoring weather changes.
Tasks:
Find out what a weather station is.
Study the history of phenology.
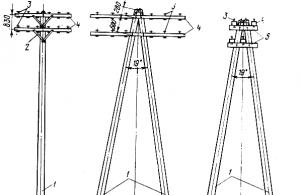
Study the structure of a weather station.
Make a weather station at home;
Observe the weather and record the results of observations in a table;
Research methods:
search (collection of information on a topic)
observations
practical (device making)
analytical (comparison of results)
Introduction.
When studying the topic “Weather and meteorological observations” in a geography lesson, we were assigned to make a meteorological instrument at home and carry out weather observations according to this instrument. I had a question: “Is it possible to create a meteorological station at home and conduct weather observations using it?”
Our distant ancestor was highly dependent on the vicissitudes of the weather. He did not understand the essence and patterns of natural phenomena and explained everything incomprehensible by the presence of a supernatural, “divine” force. By the “will of the gods,” the sun rose, it rained, the rivers dried up, and the wind blew.
All peoples deified the Sun, Moon, wind, lightning and thunder. The Eastern Slavs, before they adopted Christianity, especially revered Perun - the agricultural god, the giver of rain, the creator of lightning and thunder, who had the power to create spring greenery on the earth and trees. Having accepted the new faith, our ancestors began to honor Ilya the Thunderer.
Many peoples considered the Sun to be the main source of life on Earth. They called him "the prince of the earth and the king of the sky." Luna was revered as a princess.
Before the advent of special instruments, weather forecasting was based solely on visual observations of atmospheric phenomena, which made it possible to establish certain patterns back in ancient times. The acquired experience continued to develop and accumulate and was passed on from generation to generation for many centuries.
From the history of phenology.
Phenology - the science of the patterns of seasonal development of nature. The development of phenology is determined by the demands of practice (agriculture, fishing, hunting, forestry, nature conservation, healthcare, etc.).
Phenology makes it possible to predict seasonal phenomena and plan economic activities (environmental measures, timing of agricultural work, etc.) in accordance with the timing of these phenomena.
(№1.)
There is evidence that the most ancient peoples of the earth - the Chinese and Egyptians - in their agricultural practice knew how to monitor the seasonal development of nature. Seasonal phenomena were reflected in a number of works of ancient authors (for example, the Greek philosopher Theophrastus (372-287 BC) and the Roman writer Pliny the Younger (62-114 AD)).
In the Middle Ages, in Russian and foreign annals and chronicles, records were sometimes kept about the timing of the onset of the most important seasonal phenomena (for example, in the Krakow monastery from 1490-1527, in the palace of the Japanese Mikado from 812, etc.). However, these materials remained without systematization and scientific processing.
In Russia, the oldest is considered to be a handwritten calendar, dated 1670, and the first printed calendar should be considered “Saints or calendar, published by Kopievsky in Amsterdam and dated 1702.
The first thought about the need to observe seasonal natural phenomena in Russia belonged to Peter I.
In 1721, Peter I wrote from Moscow to St. Petersburg A.D. Menishkov: “When the trees begin to spread out, then order them to send us news of them, weekly, pasting them on paper with signed numbers, in order to find out where spring began earlier.” And by the decree of the sovereign, issued on March 28, 1722, Admiral Kruys was ordered to keep systematic records about the state of the weather in St. Petersburg.
In the second half of the 18th century, guards at the Kremlin wall were required to note the state of frost, the onset of a snowstorm, the thickness of the snow cover, the nature of the wind, hail, thunderstorms and other weather indicators.
Since 1864, the “Kiev Folk Calendar” began to be published with weather forecasts for each month. His goal was “to give the people knowledge in a popular form through strictly scientifically presented articles and in a reference department adapted to the needs of the people.” Now this task is meteorology - the science of weather. It got its name from the Greek word “meteora” - “something in the sky”.
After the 1917 revolution, meteorology continued to improve. Currently, the hydrometeorological service has thousands of observation stations, many observatories and a number of research institutions. Weather service workers strive to provide information not only for the short term, but also for the long term.
№2.
The concept of a weather station, its composition.
A weather station is a collection of various instruments for meteorological measurements (weather observations).
In a narrow sense, a weather station is an institution that conducts meteorological observations. The main official weather stations in the world are assigned synoptic indices. In Russia, most weather stations are managed by Roshydromet. Depending on the established volume of observations, weather stations have a certain category. Data from USSR weather stations were published in the Meteorological Monthly.
There are analogue and digital weather stations.
The classic (analog) weather station has:
1.Thermometer for measuring air and soil temperature.
2. Barometer for measuring pressure.
3. Anemometer for wind direction.
4. Precipitation gauge (pluviograph) for measuring precipitation.
5. Hygrometer for measuring air humidity
6. Snow measuring staff - a staff designed to measure the thickness of snow cover during meteorological observations.
7. Thermograph - a recorder that continuously records air temperature.
№3.
4.Meteorological instruments:
Thermometer (Greek θέρμη - heat; μετρέω - measure) - a device for measuring the temperature of air, soil, water, and so on. There are several types of thermometer: liquid; mechanical; electronic;
Barometer (ancient Greek βάρος - “heaviness” and μετρέω - “I measure”) - a device for measuring atmospheric pressure. The mercury barometer was invented by the Italian mathematician and physicist Evangelista Torricelli in 1644; it was a plate with mercury poured into it and a test tube (flask) placed with the hole facing down. When atmospheric pressure increased, the mercury in the test tube rose, and when it decreased, the mercury fell. Due to the inconvenience, this design ceased to be used and gave way to the aneroid barometer, but the method by which such a barometer was made began to be used in thermometers.
A.A. Letyagin. Geography. Primary course: 5th grade: textbook for students of general education organizations/A.A. Letyagin; edited by V.P. Dronova.-3rd edition, revised. and additional - M.: Ventana-Graf, 2015 - 160 p.
In this project, you will create a DIY indoor desktop weather station. You might think that there have been many such projects already, but this project will be based on the new ESP32 chip, it will also be equipped with a new BME280 sensor, this sensor measures temperature, humidity and atmospheric pressure.
When the desktop weather station is turned on, it will connect to WiFi and request the latest weather forecast for the given area. It will then display it, along with the sensor data, on the 3.2″ display. The sensor data will be updated every 2 seconds, and the weather data will be updated every hour. As you can see, in this project we will be using the latest technology available today. If you have DIY experience, the project will only take you 5 minutes.
If you are a beginner, then watch the video, which explains the nuances of assembly.
Step 1: Station Components
To build our station, we will need:
- ESP32 board (link)
- BME280 I2C sensor (link)
- Display 3.2” Nextion (link)
- Small development board (link)
- Some wires (link)
The cost of the project will vary around $30.
You can use the cheaper ESP8266 chip instead of the ESP32 module, but I decided to use the ESP32 to get an idea of this new module and see how it works.
Step 2: ESP32


This is the first project I've built using an ESP32 chip. If you're not familiar with it, the ESP32 chip is the next generation of the popular ESP8266 chip. The ESP32 provides two 32-process cores running at 160MHz, a large amount of memory, WiFi, Bluetooth and many other features. And it's only $7.
Watch the video with my detailed description of this board. It will help you understand why this chip will change the way we create things.
Step 3: Nextion Display

This is also the first project where I've used a Nextion touchscreen display. This is a new type of display that is equipped with its own ARM processor, which allows you to customize the display and create a graphical interface. So we can use it with any microcontroller and get good results.
Step 4: BME280 Sensor


The BME280 sensor is the latest sensor from Bosch. It can measure temperature, humidity and atmospheric pressure. We only need one sensor to assemble an entire weather station.
In addition, this sensor is very small and easy to operate. The sensor is controlled via the I2C interface, so interaction with Arduino will be very simple - for stable operation we will need to power it and solder only a couple of wires.
There are also many libraries developed for this sensor, so we can use any of them in our project.
Note: We need a BME280 sensor. There is also a BMP280 sensor that does not measure air humidity. Check the name before you buy the sensor.
Step 5: Putting the Pieces Together


The connection of the modules is quite simple, you can see this in the attached diagram.
Since the BME280 sensor uses an I2C interface, we only need two wires to connect it to the ESP32. I connected the sensor to pins 26 and 27. In theory, each digital pin of the ESP32 board can be used to interface with peripherals running on I2C. In practice, I found that some pins do not work because they are reserved for other purposes. Pins 26 and 27 work without interruption.
To send data to the display, we need to connect a wire to the TX0 pin on the ESP32. I had to bend the pin 90 degrees to connect it to the display as the ESP32 board was too big for a breadboard.
After assembling all the parts, we need to upload the code to the ESP32 and also upload the interface to the Nextion display. If you have any difficulties flashing the ESP32 firmware, hold down the BOOT button immediately after pressing the download button in the Arduino IDE.
To upload the interface to the display, copy the WeatherStation.tft file attached below to an empty SD card. Place the card in the slot located on the back of the display. After power is applied, the interface will be loaded into the display - you can turn it off and remove the card, then turn it on again.
After successfully downloading the code, the station will connect to WiFi, request weather data from openweathermap.org, and also display data from the sensor. Let's now look at the software part of the project.
Step 6: Project Code


To parse weather data, we need a JSON library for Arduino. We also need a library for the sensor.
Let's look at the code. First we need to send the SSID and password of our WiFi network. Next we need to enter the API key from operweathermap.org. To create your own key, you need to register on the site. Getting the current weather is free, but the site offers more services if you want to pay for them. Then we need to find our location ID. Find your locality and copy its ID from the URL.
Then copy your ID into the CityID variable. Also copy the altitude above sea level for your locality. This is necessary for the barometer to show accurate data.
Const char* ssid = "yourSSID"; const char* password = "yourPassword"; String CityID = "253394"; //Sparta, Greece String APIKEY = "yourAPIkey"; #define ALTITUDE 216.0 // Altitude in Sparta, Greece
We will receive the response in JSON format. Before sending the data to the JSON library, I manually removed some characters that were causing problems. After this, the library quietly accepts the data, and we can save it into variables. After saving the data into variables, all we need to do is display it on the display and wait until it is updated an hour later. I only showed the weather forecast on the display, but you can display more information if you wish - everything is saved in variables. Then we read information about temperature, humidity, pressure from the sensor and also send them to the display.
To update the information on the display, we simply send commands to the serial port:
Void showConnectingIcon() ( Serial.println(); String command = "weatherIcon.pic=3"; Serial.print(command); endNextionCommand(); )
The Nextion display interface consists of a background, text blocks and a picture that changes depending on the weather. Check your display's manual to learn more about its capabilities. You can quickly design your interface if you want the display to show more data.
Or you can just use my code included with this tutorial.
Files
Step 7: Final Thoughts and Improvements

As you can see, today, a sophisticated person can assemble amazing things with his own hands in just a few hours and by writing just a few lines of code. Projects of this level were unimaginable even two years ago.
Of course, this is just the beginning of the project. I would like to add a lot of improvements to it, such as graphics, touch functionality, maybe replace the display with a larger one. I would also 3D print a beautiful case. I would also design a more interesting interface and icons. And I already have some fresh ideas for indoor weather stations that can be implemented!
From the parts lying around I decided to make a small weather station. It took two weekend days to assemble and write the firmware for the controller. Another couple of days were spent writing, testing and debugging the rest of the software. The current version of the weather station measures temperature, humidity, pressure, there is a connection with a computer via a USB port and is powered from the same, backup power is from a 9 V battery. The data is displayed on the LCD. There's still a clock. Since I couldn’t find a suitable quartz (and I didn’t want to buy it on principle), I synchronized the time with the computer.
This project is absolutely non-commercial, so the weather station diagram, controller firmware and all the necessary software can be downloaded. Firmware source code.
The station is assembled on a breadboard, so don't ask for a drawing of the printed circuit board.
The following main components were used:
ATMega8 - controller
MPX4115A - pressure sensor
HIH-4000 - humidity sensor
DS18B20 - temperature sensor
WH1602A - display

I used LCD on PLED technology, maybe ordinary ones like WH1602A. Temperature and humidity sensors are placed outside in a protective box.

Connect to the computer

Connecting to a USB port requires a separate description.
In principle, it could have been connected to the COM port, it would have been easier. But he's busy for me. There is no choice - USB. Since the station was being assembled from scratch, a stub of CA-42 cable lying around was used to connect a mobile phone to a computer. The connector to the mobile phone is gone, but the end that connects to the computer remains. This connector itself already has a microcircuit for the USB port, and the output is a standard UART, the one used in mobile phones and just right for a controller, so we solder the wires directly, without any signal converters. After installing the drivers for this cable, a virtual COM port appears. Next, we can connect to our weather station with any program, for example HyperTerminal. I don’t specifically give the cable layout, since the cables are different and may differ. You need to use 3 wires TX, RX, GND. Most likely, it will not be possible to power the device from a cable. I took the unnecessary USB connector and powered it from another USB port.
In order to be able to send commands from the command line and receive a response from a weather station, the getfromcom.exe program was written.
The weather station understands only two commands:
AGOV - Returns current sensor readings.
SETTIME [time in seconds since the beginning of the day] - the command sets the time in the weather station
To obtain data, run getfromcom.exe COM6 AGOV
To set the time, run getfromcom.exe COM6 "SETTIME 72565"
COM6 - port.
72565 - number of seconds since the beginning of the day.
Process automation
Now you can read, process the data with any program, send it wherever you need it, and synchronize the time of the weather station. I did this using the PHP scripting language. Firstly, it’s fast and you can always quickly correct the script and not have to look for where the source code went. Secondly, I work with PHP all the time. But you can write your program in any language convenient for you. Of course, for PHP to work, you will have to download it (http://www.php.net/downloads.php) and install it on your computer. Under Windows this is done easily. The getfromcom.php script is launched from the get_data.bat file, queries the weather station, processes the data and sends it to the get_data.php script to the HTTP server. We'll talk about scripts on the server a little later.
Sleep mode of a working computer
My computer is in sleep mode. It wakes up every 3 hours, polls the weather station, sends data to the server and falls asleep again (you don’t have to turn it off - whatever is more convenient for you). This is done like this: In the task scheduler, the batch file get_data.bat is specified for execution and the option “wake up the computer to run this task” is set.
The computer goes into hibernation with the command fShutdown.exe /hibernate
Now at the specified time the computer will wake up and execute get_data.bat
Features of get_data.bat
Teams:
devcon.exe enable PCIVEN_10EC
ping 127.0.0.1
RASPHONE -d Setilite
They start a network connection and connect the VPN to my Internet provider.
ping 127.0.0.1 - so I took the necessary pause.
Accordingly, we disable it with the commands:
RASPHONE -h Setilite
devcon.exe disable PCIVEN_10EC
Everything will be different for you, so these lines are commented out in the file.
After waking up from hibernation, the computer began to think that the COM port was occupied by another program. I had to restart the virtual COM port with the command devcon.exe restart "USBVid_6547&PID_0232"
You will have a different device ID.
Server scripts:
Now about the scripts on the server. Script that receives data: get_data.php
The script saves data to the pogoda.log file. In fact, the data is also sent to the MySQL database. But for simplicity, we will consider working only with a file. When receiving data, the script checks whether the sender's IP address is suitable. Allowed addresses are listed in the ip_allow.lst file. Data from a “foreign” sender is not accepted.